


 Copy to clipboard
Stryker reported 2Q20 orthopedic revenue of USD $1,276.9 million, -32.8% vs. 2Q19. After the market low point in April, Stryker saw significant improvement in its orthopedic business as the quarter progressed. Across all product lines, June sales were down -10% after a decline of -36% in April. The positive trend continued in July, and Stryker leadership remains optimistic about the third quarter.
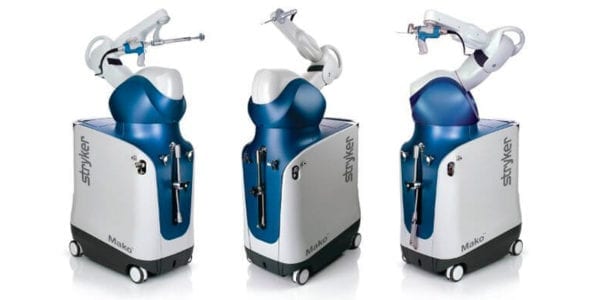
Despite hospital financial constraints, Mako delivered a standout performance in the quarter. Additionally, the company launched a new software upgrade for Mako’s hip system aimed at improving ease of use. Stryker noted slightly higher robot placements in competitive accounts and ASCs. Leadership also pushed back on the notion that Smith+Nephew’s CT-free CORI system is better positioned for ASCs, saying that CT scanners have been “no barrier whatsoever” to the placement of Mako in outpatient centers.
Stryker is actively evaluating what pandemic-related cost-saving measures may become permanent, including remote work arrangements, reduced travel and a reduced real estate footprint. While the company plans to remain active in seeking out tuck-in acquisition opportunities, it will enter 2021 highly leveraged and intends to pay down its debt. Integration efforts regarding Wright Medical are continuing as planned, and Stryker will divest its STAR total ankle replacement line to obtain the required regulatory approvals for that transaction.
“The pandemic has shown us how effective we can be without having to be the high cost, high travel company we’ve been historically. We’re a very high touch culture. We’re realizing that there’s a lot that we can do virtually that will be permanent.” – Kevin Lobo, Stryker Chairman CEO
Revenue Data
All revenue data is provided in USD millions unless otherwise noted. Sales and growth rates are estimated on an as-reported basis.
Segment Sales
| 2Q20 | 2Q19 | $ Chg | % Chg | |
|---|---|---|---|---|
| Joint Replacement | $607.5 | $981.9 | ($374.4) | (38.1%) |
| Knees | $310.9 | $528.8 | ($217.9) | (41.2%) |
| Hips | $268.7 | $410.6 | ($142.0) | (34.6%) |
| Extremities | $28.0 | $42.5 | ($14.5) | (34.1%) |
| Spine | $169.3 | $278.1 | ($108.8) | (39.1%) |
| Trauma | $299.8 | $358.2 | ($58.4) | (16.3%) |
| Sports Medicine | $94.7 | $146.3 | ($51.6) | (35.3%) |
| Orthobiologics | $45.4 | $60.6 | ($15.2) | (25.1%) |
| Other (CMF) | $60.2 | $73.8 | ($13.6) | (18.4%) |
| Total | $1,276.9 | $1,898.9 | ($622.0) | (32.8%) |
| 1H20 | 1H19 | $ Chg | % Chg | |
|---|---|---|---|---|
| Joint Replacement | $1,531.5 | $1,934.5 | ($403.0) | (20.8%) |
| Knees | $819.6 | $1,044.6 | ($225.1) | (21.5%) |
| Hips | $643.9 | $806.3 | ($162.5) | (20.1%) |
| Extremities | $68.1 | $83.5 | ($15.4) | (18.5%) |
| Spine | $417.8 | $535.7 | ($117.8) | (22%) |
| Trauma | $656.1 | $716.8 | ($60.7) | (8.5%) |
| Sports Medicine | $231.0 | $290.8 | ($59.8) | (20.6%) |
| Orthobiologics | $103.5 | $120.1 | ($16.6) | (13.9%) |
| Other (CMF) | $130.6 | $147.6 | ($17.0) | (11.5%) |
| Total | $3,070.6 | $3,745.5 | ($674.9) | (18%) |
Geographic Sales
| 2Q20 | 2Q19 | $ Chg | % Chg | |
|---|---|---|---|---|
| US | $932.9 | $1,398.3 | ($465.4) | (33.3%) |
| OUS | $344.0 | $500.6 | ($156.6) | (31.3%) |
| EMEA | $166.0 | $246.9 | ($80.9) | (32.8%) |
| Asia Pacific | $161.4 | $225.3 | ($63.9) | (28.4%) |
| Rest of World | $16.6 | $28.5 | ($11.9) | (41.7%) |
| Total | $1,276.9 | $1,898.9 | ($622.0) | (32.8%) |
| 1H20 | 1H19 | $ Chg | % Chg | |
|---|---|---|---|---|
| US | $2,249.5 | $2,719.5 | ($470.0) | (17.3%) |
| OUS | $821.1 | $1,026.0 | ($204.9) | (20%) |
| EMEA | $417.1 | $509.1 | ($92.0) | (18.1%) |
| Asia Pacific | $360.5 | $457.9 | ($97.5) | (21.3%) |
| Rest of World | $43.5 | $59.0 | ($15.5) | (26.3%) |
| Total | $3,070.6 | $3,745.5 | ($674.9) | (18%) |
Earnings
| Amt | % of Sales | |
|---|---|---|
| Sales | $2,764.0 | |
| Cost of Sales | $1,216.0 | 44% |
| Selling and Admin | $1,225.0 | 44.3% |
| R & D | $233.0 | 8.4% |
| Other | $173.0 | 6.3% |
| Net Earnings | ($83.0) | (3%) |
Mike Evers is ORTHOWORLD’s Digital Content Strategist. He can be reached by email.
Stryker reported 2Q20 orthopedic revenue of USD $1,276.9 million, -32.8% vs. 2Q19. After the market low point in April, Stryker saw significant improvement in its orthopedic business as the quarter progressed. Across all product lines, June sales were down -10% after a decline of -36% in April. The positive trend continued in July, and...
Stryker reported 2Q20 orthopedic revenue of USD $1,276.9 million, -32.8% vs. 2Q19. After the market low point in April, Stryker saw significant improvement in its orthopedic business as the quarter progressed. Across all product lines, June sales were down -10% after a decline of -36% in April. The positive trend continued in July, and Stryker leadership remains optimistic about the third quarter.
Despite hospital financial constraints, Mako delivered a standout performance in the quarter. Additionally, the company launched a new software upgrade for Mako’s hip system aimed at improving ease of use. Stryker noted slightly higher robot placements in competitive accounts and ASCs. Leadership also pushed back on the notion that Smith+Nephew’s CT-free CORI system is better positioned for ASCs, saying that CT scanners have been “no barrier whatsoever” to the placement of Mako in outpatient centers.
Stryker is actively evaluating what pandemic-related cost-saving measures may become permanent, including remote work arrangements, reduced travel and a reduced real estate footprint. While the company plans to remain active in seeking out tuck-in acquisition opportunities, it will enter 2021 highly leveraged and intends to pay down its debt. Integration efforts regarding Wright Medical are continuing as planned, and Stryker will divest its STAR total ankle replacement line to obtain the required regulatory approvals for that transaction.
“The pandemic has shown us how effective we can be without having to be the high cost, high travel company we’ve been historically. We’re a very high touch culture. We’re realizing that there’s a lot that we can do virtually that will be permanent.” – Kevin Lobo, Stryker Chairman CEO
Revenue Data
All revenue data is provided in USD millions unless otherwise noted. Sales and growth rates are estimated on an as-reported basis.
Segment Sales
| 2Q20 | 2Q19 | $ Chg | % Chg | |
|---|---|---|---|---|
| Joint Replacement | $607.5 | $981.9 | ($374.4) | (38.1%) |
| Knees | $310.9 | $528.8 | ($217.9) | (41.2%) |
| Hips | $268.7 | $410.6 | ($142.0) | (34.6%) |
| Extremities | $28.0 | $42.5 | ($14.5) | (34.1%) |
| Spine | $169.3 | $278.1 | ($108.8) | (39.1%) |
| Trauma | $299.8 | $358.2 | ($58.4) | (16.3%) |
| Sports Medicine | $94.7 | $146.3 | ($51.6) | (35.3%) |
| Orthobiologics | $45.4 | $60.6 | ($15.2) | (25.1%) |
| Other (CMF) | $60.2 | $73.8 | ($13.6) | (18.4%) |
| Total | $1,276.9 | $1,898.9 | ($622.0) | (32.8%) |
| 1H20 | 1H19 | $ Chg | % Chg | |
|---|---|---|---|---|
| Joint Replacement | $1,531.5 | $1,934.5 | ($403.0) | (20.8%) |
| Knees | $819.6 | $1,044.6 | ($225.1) | (21.5%) |
| Hips | $643.9 | $806.3 | ($162.5) | (20.1%) |
| Extremities | $68.1 | $83.5 | ($15.4) | (18.5%) |
| Spine | $417.8 | $535.7 | ($117.8) | (22%) |
| Trauma | $656.1 | $716.8 | ($60.7) | (8.5%) |
| Sports Medicine | $231.0 | $290.8 | ($59.8) | (20.6%) |
| Orthobiologics | $103.5 | $120.1 | ($16.6) | (13.9%) |
| Other (CMF) | $130.6 | $147.6 | ($17.0) | (11.5%) |
| Total | $3,070.6 | $3,745.5 | ($674.9) | (18%) |
Geographic Sales
| 2Q20 | 2Q19 | $ Chg | % Chg | |
|---|---|---|---|---|
| US | $932.9 | $1,398.3 | ($465.4) | (33.3%) |
| OUS | $344.0 | $500.6 | ($156.6) | (31.3%) |
| EMEA | $166.0 | $246.9 | ($80.9) | (32.8%) |
| Asia Pacific | $161.4 | $225.3 | ($63.9) | (28.4%) |
| Rest of World | $16.6 | $28.5 | ($11.9) | (41.7%) |
| Total | $1,276.9 | $1,898.9 | ($622.0) | (32.8%) |
| 1H20 | 1H19 | $ Chg | % Chg | |
|---|---|---|---|---|
| US | $2,249.5 | $2,719.5 | ($470.0) | (17.3%) |
| OUS | $821.1 | $1,026.0 | ($204.9) | (20%) |
| EMEA | $417.1 | $509.1 | ($92.0) | (18.1%) |
| Asia Pacific | $360.5 | $457.9 | ($97.5) | (21.3%) |
| Rest of World | $43.5 | $59.0 | ($15.5) | (26.3%) |
| Total | $3,070.6 | $3,745.5 | ($674.9) | (18%) |
Earnings
| Amt | % of Sales | |
|---|---|---|
| Sales | $2,764.0 | |
| Cost of Sales | $1,216.0 | 44% |
| Selling and Admin | $1,225.0 | 44.3% |
| R & D | $233.0 | 8.4% |
| Other | $173.0 | 6.3% |
| Net Earnings | ($83.0) | (3%) |
Mike Evers is ORTHOWORLD’s Digital Content Strategist. He can be reached by email.

You’ve reached your limit.
We’re glad you’re finding value in our content — and we’d love for you to keep going.
Subscribe now for unlimited access to orthopedic business intelligence.

ME
Mike Evers is a Senior Market Analyst and writer with over 15 years of experience in the medical industry, spanning cardiac rhythm management, ER coding and billing, and orthopedics. He joined ORTHOWORLD in 2018, where he provides market analysis and editorial coverage.


