Copy to clipboard
Stryker reported 2Q25 orthopedic sales of $2.7 billion, up 3% compared to the second quarter of 2024. Excluding its divested spinal implant business, growth would have been 10.3%. For the first half of 2025, the company generated $5.4 billion in orthopedic sales, up 6.1% compared to the prior period.
Stryker remains bullish on the market environment despite ongoing trade and geopolitical uncertainty, citing healthy procedure volumes, adoption of robotic-assisted surgery, stable pricing, favorable demographic shifts and ongoing ASC acceleration.
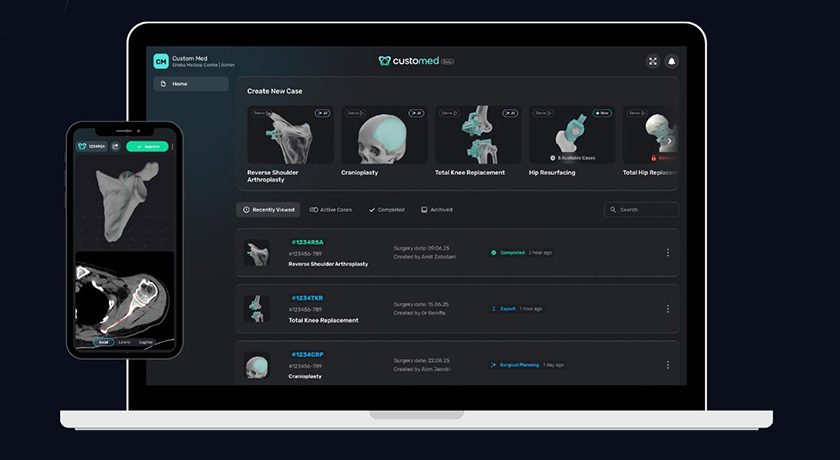
The company’s Mako platform surpassed 2 million procedures, and saw the release of version 4 in the second quarter, which was the best second quarter ever for Mako installations. Stryker doesn’t seem moved by Zimmer Biomet’s acquisition of Monogram or the prospect of autonomous robots.
“We’re aware of their portfolio, and we know that they were pursuing autonomous,” said Stryker CEO Kevin Lobo. “We have the capability today to do Mako autonomous. I’ve actually been in the lab where I’ve actually seen it operate autonomously. We have chosen not to pursue that because of the regulatory burden and the expenses required to get it through FDA. At some point in the future, if the market really has an appetite for autonomous, we can turn that feature on. Right now, that’s not our focus. Our focus is using our R&D dollars to add new applications that provide tremendous value.”
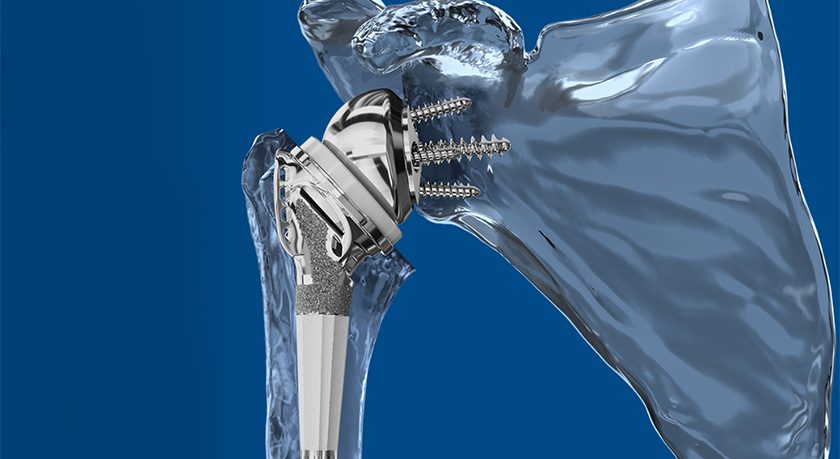
Outside of robotics, Stryker is driving tremendous growth in sports medicine, core trauma and upper extremities. Growth drivers are lining up for next year as well, with the pending OUS approvals for the Pangea plating system and Insignia hip. Mako Spine and Mako Shoulder should start sales contributions in 2026 as well.
For the full year 2025, Stryker expects total sales organic growth between 9.5% and 10%.
Orthopedic Sales Data
Unless otherwise noted, all orthopedic sales data is provided in USD millions. We estimate orthopedic sales and growth rates on an as-reported basis.
Orthopedic Sales by Segment
| Segment | 2Q25 | 2Q24 | $ Chg | % Chg |
|---|---|---|---|---|
| Joint Replacement | $1,345.3 | $1,236.1 | $109.2 | 8.8% |
| Knees | $639.7 | $601.9 | $37.8 | 6.3% |
| Hips | $466.3 | $428.3 | $38.0 | 8.9% |
| Extremities | $239.3 | $205.9 | $33.4 | 16.2% |
| Spine | $5.0 | $178.0 | ($173.0) | (97.2%) |
| Trauma | $718.0 | $626.2 | $91.8 | 14.7% |
| Sports Medicine | $236.2 | $210.9 | $25.3 | 12% |
| Orthobiologics | $81.6 | $80.6 | $1.0 | 1.2% |
| Enabling Technology | $118.9 | $105.2 | $13.6 | 13% |
| Other | $192.7 | $182.9 | $9.9 | 5.4% |
| Total | $2,697.7 | $2,619.9 | $77.8 | 3% |
| Segment | 1H25 | 1H24 | $ Chg | % Chg |
|---|---|---|---|---|
| Joint Replacement | $2,664.4 | $2,435.8 | $228.6 | 9.4% |
| Knees | $1,279.2 | $1,190.0 | $89.1 | 7.5% |
| Hips | $909.7 | $821.9 | $87.8 | 10.7% |
| Extremities | $475.5 | $423.9 | $51.7 | 12.2% |
| Spine | $171.0 | $348.9 | ($177.9) | (51%) |
| Trauma | $1,426.6 | $1,238.5 | $188.2 | 15.2% |
| Sports Medicine | $451.8 | $409.0 | $42.7 | 10.4% |
| Orthobiologics | $157.7 | $156.1 | $1.6 | 1% |
| Enabling Technology | $224.7 | $209.1 | $15.6 | 7.5% |
| Other | $369.2 | $352.7 | $16.5 | 4.7% |
| Total | $5,465.5 | $5,150.1 | $315.4 | 6.1% |
| Region | 1H25 | 1H24 | $ Chg | % Chg |
|---|---|---|---|---|
| US | $3,871.7 | $3,651.7 | $220.0 | 6% |
| OUS | $1,593.7 | $1,498.4 | $95.3 | 6.4% |
| EMEA | $782.6 | $727.8 | $54.8 | 7.5% |
| APAC | $537.1 | $508.5 | $28.6 | 5.6% |
| ROW | $274.0 | $262.2 | $11.9 | 4.5% |
| Total | $5,465.5 | $5,150.1 | $315.4 | 6.1% |
Orthopedic Sales by Geography
| Region | 2Q25 | 2Q24 | $ Chg | % Chg |
|---|---|---|---|---|
| US | $1,886.7 | $1,840.6 | $46.1 | 2.5% |
| OUS | $811.1 | $779.3 | $31.7 | 4.1% |
| EMEA | $397.9 | $379.9 | $18.0 | 4.7% |
| APAC | $260.3 | $255.4 | $4.9 | 1.9% |
| ROW | $152.8 | $144.0 | $8.8 | 6.1% |
| Total | $2,697.7 | $2,619.9 | $77.8 | 3% |
Company Earnings
| Amt | % of Sales | |
|---|---|---|
| Sales | $6,022.0 | |
| Cost of Sales | $2,181.0 | 36.2% |
| Selling and Admin | $2,079.0 | 34.5% |
| R & D | $407.0 | 6.8% |
| R & D | $407.0 | 6.8% |
| Other | $471.0 | 7.8% |
Stryker reported 2Q25 orthopedic sales of $2.7 billion, up 3% compared to the second quarter of 2024. Excluding its divested spinal implant business, growth would have been 10.3%. For the first half of 2025, the company generated $5.4 billion in orthopedic sales, up 6.1% compared to the prior period.
Stryker remains bullish on the market...
Stryker reported 2Q25 orthopedic sales of $2.7 billion, up 3% compared to the second quarter of 2024. Excluding its divested spinal implant business, growth would have been 10.3%. For the first half of 2025, the company generated $5.4 billion in orthopedic sales, up 6.1% compared to the prior period.
Stryker remains bullish on the market environment despite ongoing trade and geopolitical uncertainty, citing healthy procedure volumes, adoption of robotic-assisted surgery, stable pricing, favorable demographic shifts and ongoing ASC acceleration.
The company’s Mako platform surpassed 2 million procedures, and saw the release of version 4 in the second quarter, which was the best second quarter ever for Mako installations. Stryker doesn’t seem moved by Zimmer Biomet’s acquisition of Monogram or the prospect of autonomous robots.
“We’re aware of their portfolio, and we know that they were pursuing autonomous,” said Stryker CEO Kevin Lobo. “We have the capability today to do Mako autonomous. I’ve actually been in the lab where I’ve actually seen it operate autonomously. We have chosen not to pursue that because of the regulatory burden and the expenses required to get it through FDA. At some point in the future, if the market really has an appetite for autonomous, we can turn that feature on. Right now, that’s not our focus. Our focus is using our R&D dollars to add new applications that provide tremendous value.”
Outside of robotics, Stryker is driving tremendous growth in sports medicine, core trauma and upper extremities. Growth drivers are lining up for next year as well, with the pending OUS approvals for the Pangea plating system and Insignia hip. Mako Spine and Mako Shoulder should start sales contributions in 2026 as well.
For the full year 2025, Stryker expects total sales organic growth between 9.5% and 10%.
Orthopedic Sales Data
Unless otherwise noted, all orthopedic sales data is provided in USD millions. We estimate orthopedic sales and growth rates on an as-reported basis.
Orthopedic Sales by Segment
| Segment | 2Q25 | 2Q24 | $ Chg | % Chg |
|---|---|---|---|---|
| Joint Replacement | $1,345.3 | $1,236.1 | $109.2 | 8.8% |
| Knees | $639.7 | $601.9 | $37.8 | 6.3% |
| Hips | $466.3 | $428.3 | $38.0 | 8.9% |
| Extremities | $239.3 | $205.9 | $33.4 | 16.2% |
| Spine | $5.0 | $178.0 | ($173.0) | (97.2%) |
| Trauma | $718.0 | $626.2 | $91.8 | 14.7% |
| Sports Medicine | $236.2 | $210.9 | $25.3 | 12% |
| Orthobiologics | $81.6 | $80.6 | $1.0 | 1.2% |
| Enabling Technology | $118.9 | $105.2 | $13.6 | 13% |
| Other | $192.7 | $182.9 | $9.9 | 5.4% |
| Total | $2,697.7 | $2,619.9 | $77.8 | 3% |
| Segment | 1H25 | 1H24 | $ Chg | % Chg |
|---|---|---|---|---|
| Joint Replacement | $2,664.4 | $2,435.8 | $228.6 | 9.4% |
| Knees | $1,279.2 | $1,190.0 | $89.1 | 7.5% |
| Hips | $909.7 | $821.9 | $87.8 | 10.7% |
| Extremities | $475.5 | $423.9 | $51.7 | 12.2% |
| Spine | $171.0 | $348.9 | ($177.9) | (51%) |
| Trauma | $1,426.6 | $1,238.5 | $188.2 | 15.2% |
| Sports Medicine | $451.8 | $409.0 | $42.7 | 10.4% |
| Orthobiologics | $157.7 | $156.1 | $1.6 | 1% |
| Enabling Technology | $224.7 | $209.1 | $15.6 | 7.5% |
| Other | $369.2 | $352.7 | $16.5 | 4.7% |
| Total | $5,465.5 | $5,150.1 | $315.4 | 6.1% |
| Region | 1H25 | 1H24 | $ Chg | % Chg |
|---|---|---|---|---|
| US | $3,871.7 | $3,651.7 | $220.0 | 6% |
| OUS | $1,593.7 | $1,498.4 | $95.3 | 6.4% |
| EMEA | $782.6 | $727.8 | $54.8 | 7.5% |
| APAC | $537.1 | $508.5 | $28.6 | 5.6% |
| ROW | $274.0 | $262.2 | $11.9 | 4.5% |
| Total | $5,465.5 | $5,150.1 | $315.4 | 6.1% |
Orthopedic Sales by Geography
| Region | 2Q25 | 2Q24 | $ Chg | % Chg |
|---|---|---|---|---|
| US | $1,886.7 | $1,840.6 | $46.1 | 2.5% |
| OUS | $811.1 | $779.3 | $31.7 | 4.1% |
| EMEA | $397.9 | $379.9 | $18.0 | 4.7% |
| APAC | $260.3 | $255.4 | $4.9 | 1.9% |
| ROW | $152.8 | $144.0 | $8.8 | 6.1% |
| Total | $2,697.7 | $2,619.9 | $77.8 | 3% |
Company Earnings
| Amt | % of Sales | |
|---|---|---|
| Sales | $6,022.0 | |
| Cost of Sales | $2,181.0 | 36.2% |
| Selling and Admin | $2,079.0 | 34.5% |
| R & D | $407.0 | 6.8% |
| R & D | $407.0 | 6.8% |
| Other | $471.0 | 7.8% |

You’ve reached your limit.
We’re glad you’re finding value in our content — and we’d love for you to keep going.
Subscribe now for unlimited access to orthopedic business intelligence.

ME
Mike Evers is a Senior Market Analyst and writer with over 15 years of experience in the medical industry, spanning cardiac rhythm management, ER coding and billing, and orthopedics. He joined ORTHOWORLD in 2018, where he provides market analysis and editorial coverage.