Copy to clipboard
Stryker reported 3Q25 orthopedic sales of $2.7 billion, up 4.9% compared to the third quarter of 2024. For the first nine months of the year, the company generated $8.2 billion in orthopedic sales, up 5.7% compared to the prior year.
Excluding its divested spinal implant business, growth was 12% for the quarter and 10.9% for the first nine months.
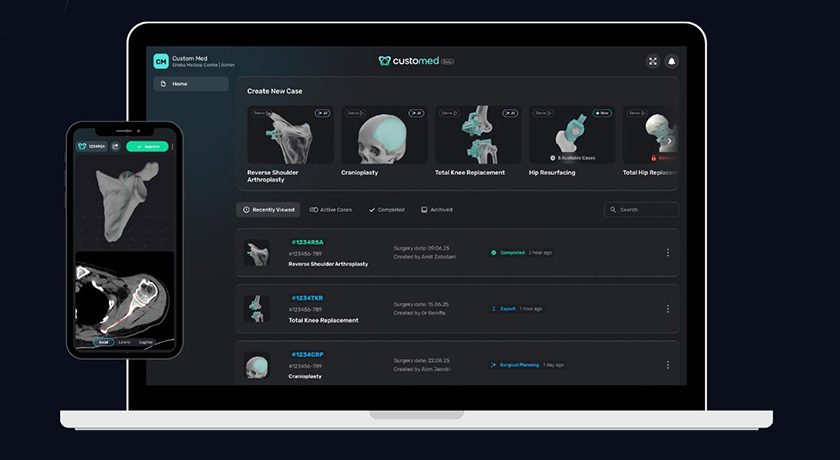
Stryker remains bullish on procedure volumes and appetite for capital products. The company saw the most Mako placements ever for a third quarter and a higher than usual number of outright purchases, leading to the tremendous enabling technology growth rate seen this quarter.
“Procedure volumes are very healthy, which affects our implants as well as our small capital,” said Stryker CEO Kevin Lobo. “The capital markets are really strong. The balance sheets are strong with hospitals. You saw this quarter, in fact, a lot of Mako purchases were cash purchases. And a year ago, those were being more leased. So balance sheets are strong. Procedure growth is strong.”
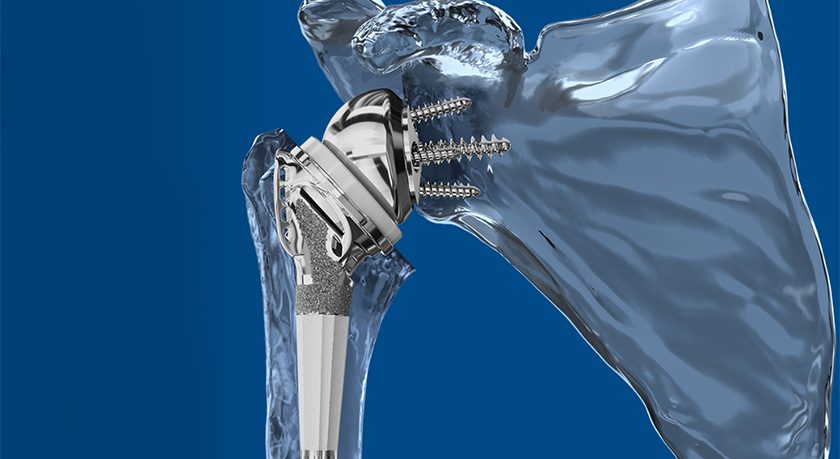
The company called out it notable performances from virtually all of its segments, especially shoulders, core trauma and sports medicine. Foot and ankle has been softer for Stryker this year, particularly for plates and nails. But the company expects to see upside in the segment entering next year.
Orthopedic Sales Data
Unless otherwise noted, all orthopedic sales data is provided in USD millions. We estimate orthopedic sales and growth rates on an as-reported basis.
Orthopedic Sales by Segment
| Segment | 3Q25 | 3Q24 | $ Chg | % Chg |
|---|---|---|---|---|
| Joint Replacement | $1,324.8 | $1,197.8 | $127.0 | 10.6% |
| Knees | $627.7 | $569.9 | $57.8 | 10.1% |
| Hips | $457.4 | $420.1 | $37.4 | 8.9% |
| Extremities | $239.7 | $207.8 | $31.8 | 15.3% |
| Spine | $5.6 | $172.0 | ($166.4) | (96.8%) |
| Trauma | $719.1 | $640.5 | $78.6 | 12.3% |
| Sports Medicine | $254.3 | $226.7 | $27.7 | 12.2% |
| Orthobiologics | $75.9 | $74.7 | $1.2 | 1.6% |
| Enabling Technology | $133.7 | $100.2 | $33.5 | 33.4% |
| Other | $212.4 | $187.5 | $24.9 | 13.3% |
| Total | $2,725.7 | $2,599.3 | $126.4 | 4.9% |
| Segment | 9m25 | 9m24 | $ Chg | % Chg |
|---|---|---|---|---|
| Joint Replacement | $3,989.2 | $3,633.6 | $355.7 | 9.8% |
| Knees | $1,906.9 | $1,759.9 | $147.0 | 8.3% |
| Hips | $1,367.2 | $1,242.0 | $125.2 | 10.1% |
| Extremities | $715.2 | $631.7 | $83.5 | 13.2% |
| Spine | $176.6 | $520.9 | ($344.3) | (66.1%) |
| Trauma | $2,145.7 | $1,879.0 | $266.7 | 14.2% |
| Sports Medicine | $706.1 | $635.7 | $70.4 | 11.1% |
| Orthobiologics | $233.6 | $230.8 | $2.8 | 1.2% |
| Enabling Technology | $359.3 | $309.3 | $50.0 | 16.2% |
| Other | $580.7 | $540.2 | $40.5 | 7.5% |
| Total | $8,191.2 | $7,749.4 | $441.8 | 5.7% |
Orthopedic Sales by Geography
| Region | 3Q25 | 3Q24 | $ Chg | % Chg |
|---|---|---|---|---|
| US | $1,922.1 | $1,829.1 | $93.0 | 5.1% |
| OUS | $803.6 | $770.2 | $33.4 | 4.3% |
| EMEA | $354.3 | $337.9 | $16.4 | 4.9% |
| Asia Pacific | $261.7 | $249.5 | $12.1 | 4.9% |
| Rest of World | $187.6 | $182.8 | $4.8 | 2.7% |
| Total | $2,725.7 | $2,599.3 | $126.4 | 4.9% |
| Region | 9m25 | 9m24 | $ Chg | % Chg |
|---|---|---|---|---|
| US | $5,793.8 | $5,480.8 | $313.0 | 5.7% |
| OUS | $2,397.4 | $2,268.6 | $128.7 | 5.7% |
| EMEA | $1,137.0 | $1,065.7 | $71.3 | 6.7% |
| Asia Pacific | $798.8 | $758.0 | $40.8 | 5.4% |
| Rest of World | $461.6 | $444.9 | $16.7 | 3.8% |
| Total | $8,191.2 | $7,749.4 | $441.8 | 5.7% |
Company Earnings
| Amt | % of Sales | |
|---|---|---|
| Sales | $6,057.0 | |
| Cost of Sales | $2,205.0 | 36.4% |
| Selling and Admin | $2,045.0 | 33.8% |
| R & D | $410.0 | 6.8% |
| Other | $538.0 | 8.9% |
| Net Earnings | $859.0 | 14.2% |
Stryker reported 3Q25 orthopedic sales of $2.7 billion, up 4.9% compared to the third quarter of 2024. For the first nine months of the year, the company generated $8.2 billion in orthopedic sales, up 5.7% compared to the prior year.
Excluding its divested spinal implant business, growth was 12% for the quarter and 10.9% for the first nine...
Stryker reported 3Q25 orthopedic sales of $2.7 billion, up 4.9% compared to the third quarter of 2024. For the first nine months of the year, the company generated $8.2 billion in orthopedic sales, up 5.7% compared to the prior year.
Excluding its divested spinal implant business, growth was 12% for the quarter and 10.9% for the first nine months.
Stryker remains bullish on procedure volumes and appetite for capital products. The company saw the most Mako placements ever for a third quarter and a higher than usual number of outright purchases, leading to the tremendous enabling technology growth rate seen this quarter.
“Procedure volumes are very healthy, which affects our implants as well as our small capital,” said Stryker CEO Kevin Lobo. “The capital markets are really strong. The balance sheets are strong with hospitals. You saw this quarter, in fact, a lot of Mako purchases were cash purchases. And a year ago, those were being more leased. So balance sheets are strong. Procedure growth is strong.”
The company called out it notable performances from virtually all of its segments, especially shoulders, core trauma and sports medicine. Foot and ankle has been softer for Stryker this year, particularly for plates and nails. But the company expects to see upside in the segment entering next year.
Orthopedic Sales Data
Unless otherwise noted, all orthopedic sales data is provided in USD millions. We estimate orthopedic sales and growth rates on an as-reported basis.
Orthopedic Sales by Segment
| Segment | 3Q25 | 3Q24 | $ Chg | % Chg |
|---|---|---|---|---|
| Joint Replacement | $1,324.8 | $1,197.8 | $127.0 | 10.6% |
| Knees | $627.7 | $569.9 | $57.8 | 10.1% |
| Hips | $457.4 | $420.1 | $37.4 | 8.9% |
| Extremities | $239.7 | $207.8 | $31.8 | 15.3% |
| Spine | $5.6 | $172.0 | ($166.4) | (96.8%) |
| Trauma | $719.1 | $640.5 | $78.6 | 12.3% |
| Sports Medicine | $254.3 | $226.7 | $27.7 | 12.2% |
| Orthobiologics | $75.9 | $74.7 | $1.2 | 1.6% |
| Enabling Technology | $133.7 | $100.2 | $33.5 | 33.4% |
| Other | $212.4 | $187.5 | $24.9 | 13.3% |
| Total | $2,725.7 | $2,599.3 | $126.4 | 4.9% |
| Segment | 9m25 | 9m24 | $ Chg | % Chg |
|---|---|---|---|---|
| Joint Replacement | $3,989.2 | $3,633.6 | $355.7 | 9.8% |
| Knees | $1,906.9 | $1,759.9 | $147.0 | 8.3% |
| Hips | $1,367.2 | $1,242.0 | $125.2 | 10.1% |
| Extremities | $715.2 | $631.7 | $83.5 | 13.2% |
| Spine | $176.6 | $520.9 | ($344.3) | (66.1%) |
| Trauma | $2,145.7 | $1,879.0 | $266.7 | 14.2% |
| Sports Medicine | $706.1 | $635.7 | $70.4 | 11.1% |
| Orthobiologics | $233.6 | $230.8 | $2.8 | 1.2% |
| Enabling Technology | $359.3 | $309.3 | $50.0 | 16.2% |
| Other | $580.7 | $540.2 | $40.5 | 7.5% |
| Total | $8,191.2 | $7,749.4 | $441.8 | 5.7% |
Orthopedic Sales by Geography
| Region | 3Q25 | 3Q24 | $ Chg | % Chg |
|---|---|---|---|---|
| US | $1,922.1 | $1,829.1 | $93.0 | 5.1% |
| OUS | $803.6 | $770.2 | $33.4 | 4.3% |
| EMEA | $354.3 | $337.9 | $16.4 | 4.9% |
| Asia Pacific | $261.7 | $249.5 | $12.1 | 4.9% |
| Rest of World | $187.6 | $182.8 | $4.8 | 2.7% |
| Total | $2,725.7 | $2,599.3 | $126.4 | 4.9% |
| Region | 9m25 | 9m24 | $ Chg | % Chg |
|---|---|---|---|---|
| US | $5,793.8 | $5,480.8 | $313.0 | 5.7% |
| OUS | $2,397.4 | $2,268.6 | $128.7 | 5.7% |
| EMEA | $1,137.0 | $1,065.7 | $71.3 | 6.7% |
| Asia Pacific | $798.8 | $758.0 | $40.8 | 5.4% |
| Rest of World | $461.6 | $444.9 | $16.7 | 3.8% |
| Total | $8,191.2 | $7,749.4 | $441.8 | 5.7% |
Company Earnings
| Amt | % of Sales | |
|---|---|---|
| Sales | $6,057.0 | |
| Cost of Sales | $2,205.0 | 36.4% |
| Selling and Admin | $2,045.0 | 33.8% |
| R & D | $410.0 | 6.8% |
| Other | $538.0 | 8.9% |
| Net Earnings | $859.0 | 14.2% |

You’ve reached your limit.
We’re glad you’re finding value in our content — and we’d love for you to keep going.
Subscribe now for unlimited access to orthopedic business intelligence.

ME
Mike Evers is a Senior Market Analyst and writer with over 15 years of experience in the medical industry, spanning cardiac rhythm management, ER coding and billing, and orthopedics. He joined ORTHOWORLD in 2018, where he provides market analysis and editorial coverage.