


 Copy to clipboard
SI-BONE reported 2Q20 orthopedic revenue of USD $14 million, -13.9% vs. 2Q19. The company bounced back from -85% revenue declines in April to +6% in May and then +42% in June. However, leadership expects a majority of its case backlog was exhausted in that period. June revenues were down -10% when excluding cases rescheduled from March and April. SI-BONE expects sequential improvement throughout 2020, but at slower rates than observed in the second quarter.
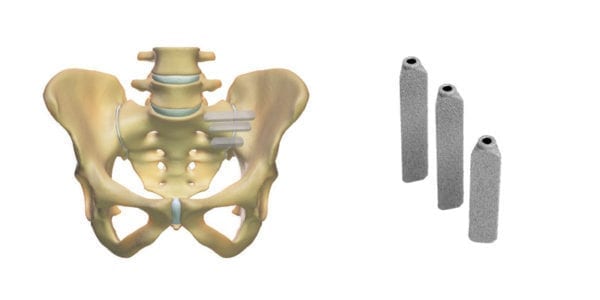
The company continued to expand its insured patient base through the quarter, adding 23.1 million covered lives through Aetna and CareSource. These coverage wins generally take about six months to translate into new cases as patients go through the conservative portions of the treatment algorithm. Additionally, SI-BONE signed a purchasing agreement with Surgical Care Affiliates, a network of 210 ASCs in 35 states. Half of those centers have neurosurgical and spine capabilities, and the deal offers centers a choice to obtain preferred pricing by using iFuse exclusively.
Revenue Data
All revenue data is provided in USD millions unless otherwise noted. Sales and growth rates are estimated on an as-reported basis.
Segment Sales
| 2Q20 | 2Q19 | $ Chg | % Chg | |
|---|---|---|---|---|
| Spine | $14.0 | $16.3 | ($2.3) | (13.9%) |
| 1H20 | 1H19 | $ Chg | % Chg | |
|---|---|---|---|---|
| Spine | $30.9 | $31.3 | ($0.4) | (1.4%) |
Geographic Sales
| 2Q20 | 2Q19 | $ Chg | % Chg | |
|---|---|---|---|---|
| US | $13.2 | $15.0 | ($1.8) | (12%) |
| OUS | $0.8 | $1.3 | ($0.5) | (36.2%) |
| Total | $14.0 | $16.3 | ($2.3) | (13.9%) |
| 1H20 | 1H19 | $ Chg | % Chg | |
|---|---|---|---|---|
| US | $28.5 | $28.5 | $0.0 | 0.2% |
| OUS | $2.4 | $2.8 | ($0.5) | (17.2%) |
| Total | $30.9 | $31.3 | ($0.4) | (1.4%) |
Earnings
| Amt | % of Sales | |
|---|---|---|
| Sales | $14.0 | |
| Cost of Sales | $2.1 | 15.1% |
| General and Admin | $5.4 | 38.4% |
| Sales and Marketing | $19.3 | 137.2% |
| R & D | $2.2 | 15.4% |
| Other | $2.3 | 16.6% |
| Net Earnings | ($12.5) | (88.8%) |
Mike Evers is ORTHOWORLD’s Digital Content Strategist. He can be reached by email.
SI-BONE reported 2Q20 orthopedic revenue of USD $14 million, -13.9% vs. 2Q19. The company bounced back from -85% revenue declines in April to +6% in May and then +42% in June. However, leadership expects a majority of its case backlog was exhausted in that period. June revenues were down -10% when excluding cases rescheduled from March...
SI-BONE reported 2Q20 orthopedic revenue of USD $14 million, -13.9% vs. 2Q19. The company bounced back from -85% revenue declines in April to +6% in May and then +42% in June. However, leadership expects a majority of its case backlog was exhausted in that period. June revenues were down -10% when excluding cases rescheduled from March and April. SI-BONE expects sequential improvement throughout 2020, but at slower rates than observed in the second quarter.
The company continued to expand its insured patient base through the quarter, adding 23.1 million covered lives through Aetna and CareSource. These coverage wins generally take about six months to translate into new cases as patients go through the conservative portions of the treatment algorithm. Additionally, SI-BONE signed a purchasing agreement with Surgical Care Affiliates, a network of 210 ASCs in 35 states. Half of those centers have neurosurgical and spine capabilities, and the deal offers centers a choice to obtain preferred pricing by using iFuse exclusively.
Revenue Data
All revenue data is provided in USD millions unless otherwise noted. Sales and growth rates are estimated on an as-reported basis.
Segment Sales
| 2Q20 | 2Q19 | $ Chg | % Chg | |
|---|---|---|---|---|
| Spine | $14.0 | $16.3 | ($2.3) | (13.9%) |
| 1H20 | 1H19 | $ Chg | % Chg | |
|---|---|---|---|---|
| Spine | $30.9 | $31.3 | ($0.4) | (1.4%) |
Geographic Sales
| 2Q20 | 2Q19 | $ Chg | % Chg | |
|---|---|---|---|---|
| US | $13.2 | $15.0 | ($1.8) | (12%) |
| OUS | $0.8 | $1.3 | ($0.5) | (36.2%) |
| Total | $14.0 | $16.3 | ($2.3) | (13.9%) |
| 1H20 | 1H19 | $ Chg | % Chg | |
|---|---|---|---|---|
| US | $28.5 | $28.5 | $0.0 | 0.2% |
| OUS | $2.4 | $2.8 | ($0.5) | (17.2%) |
| Total | $30.9 | $31.3 | ($0.4) | (1.4%) |
Earnings
| Amt | % of Sales | |
|---|---|---|
| Sales | $14.0 | |
| Cost of Sales | $2.1 | 15.1% |
| General and Admin | $5.4 | 38.4% |
| Sales and Marketing | $19.3 | 137.2% |
| R & D | $2.2 | 15.4% |
| Other | $2.3 | 16.6% |
| Net Earnings | ($12.5) | (88.8%) |
Mike Evers is ORTHOWORLD’s Digital Content Strategist. He can be reached by email.

You’ve reached your limit.
We’re glad you’re finding value in our content — and we’d love for you to keep going.
Subscribe now for unlimited access to orthopedic business intelligence.

ME
Mike Evers is a Senior Market Analyst and writer with over 15 years of experience in the medical industry, spanning cardiac rhythm management, ER coding and billing, and orthopedics. He joined ORTHOWORLD in 2018, where he provides market analysis and editorial coverage.


