Copy to clipboard
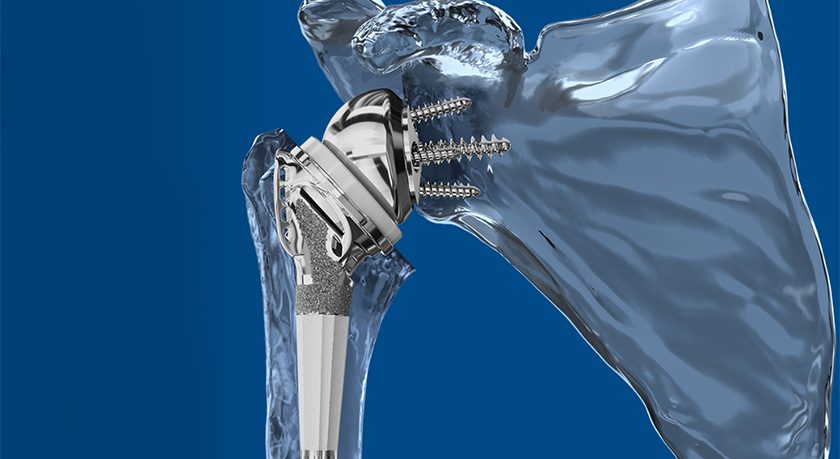
Orthofix Medical reported 1Q25 orthopedic sales of $193.6 million, up 2.7% compared to the first quarter of 2024.
While set up for significant growth, the company will contend with some short term pain points in 2025 for its U.S. spine business.
First, despite 7% procedure growth, growth was offset by a joint venture between one of Orthofix’s largest hospital accounts and a group purchasing organization that already had a pricing agreement in place with the company. The venture resulted in an outsized price decrease that will impact Orthofix for the rest of the year.
Second, the company began to transition its distribution teams in the U.S., leading to softness for spinal implants and biologics.
“Given our strengths, we realized that our current distribution network was already at capacity from the growth standpoint,” said Orthofix CEO Massimo Calafiore. “We are accelerating our transformation by investing in a larger, much more capital-efficient commercial partner to drive the long-term growth that we’re expecting.”
Excluding the discontinued M6 product line, Orthofix expects 2025 total sales between $808 million and $816 million.
Orthopedic Sales Data
Unless otherwise noted, all orthopedic sales data is provided in USD millions. We estimate orthopedic sales and growth rates on an as-reported basis.
Orthopedic Sales by Segment
| Segment | 1Q25 | 1Q24 | $ Chg | % Chg |
|---|---|---|---|---|
| Spine | $73.3 | $72.4 | $1.0 | 1.3% |
| Trauma | $29.8 | $27.3 | $2.5 | 9.1% |
| Orthobiologics | $33.7 | $34.8 | ($1.1) | (3.2%) |
| Enabling Technology | $1.7 | $1.6 | $0.1 | 6.6% |
| Other (Bone Growth Therapies) | $55.1 | $52.5 | $2.6 | 4.9% |
| Total | $193.6 | $188.6 | $5.0 | 2.7% |
Orthopedic Sales by Geography
| Region | 1Q25 | 1Q24 | $ Chg | % Chg |
|---|---|---|---|---|
| US | $161.7 | $160.0 | $1.7 | 1% |
| OUS | $32.0 | $28.6 | $3.4 | 11.8% |
| EMEA | $12.9 | $12.3 | $0.7 | 5.5% |
| ROW | $19.0 | $16.3 | $2.7 | 16.6% |
| Total | $193.6 | $188.6 | $5.0 | 2.7% |
Company Earnings
| Amt | % of Sales | |
|---|---|---|
| Sales | $193.6 | |
| Cost of Sales | $72.0 | 37.2% |
| Selling, General, Admin | $133.0 | 68.7% |
| R & D | $19.8 | 10.2% |
| R & D | $19.8 | 10.2% |
| Other | $22.0 | 11.3% |
Orthofix Medical reported 1Q25 orthopedic sales of $193.6 million, up 2.7% compared to the first quarter of 2024.
While set up for significant growth, the company will contend with some short term pain points in 2025 for its U.S. spine business.
First, despite 7% procedure growth, growth was offset by a joint venture between one of...
Orthofix Medical reported 1Q25 orthopedic sales of $193.6 million, up 2.7% compared to the first quarter of 2024.
While set up for significant growth, the company will contend with some short term pain points in 2025 for its U.S. spine business.
First, despite 7% procedure growth, growth was offset by a joint venture between one of Orthofix’s largest hospital accounts and a group purchasing organization that already had a pricing agreement in place with the company. The venture resulted in an outsized price decrease that will impact Orthofix for the rest of the year.
Second, the company began to transition its distribution teams in the U.S., leading to softness for spinal implants and biologics.
“Given our strengths, we realized that our current distribution network was already at capacity from the growth standpoint,” said Orthofix CEO Massimo Calafiore. “We are accelerating our transformation by investing in a larger, much more capital-efficient commercial partner to drive the long-term growth that we’re expecting.”
Excluding the discontinued M6 product line, Orthofix expects 2025 total sales between $808 million and $816 million.
Orthopedic Sales Data
Unless otherwise noted, all orthopedic sales data is provided in USD millions. We estimate orthopedic sales and growth rates on an as-reported basis.
Orthopedic Sales by Segment
| Segment | 1Q25 | 1Q24 | $ Chg | % Chg |
|---|---|---|---|---|
| Spine | $73.3 | $72.4 | $1.0 | 1.3% |
| Trauma | $29.8 | $27.3 | $2.5 | 9.1% |
| Orthobiologics | $33.7 | $34.8 | ($1.1) | (3.2%) |
| Enabling Technology | $1.7 | $1.6 | $0.1 | 6.6% |
| Other (Bone Growth Therapies) | $55.1 | $52.5 | $2.6 | 4.9% |
| Total | $193.6 | $188.6 | $5.0 | 2.7% |
Orthopedic Sales by Geography
| Region | 1Q25 | 1Q24 | $ Chg | % Chg |
|---|---|---|---|---|
| US | $161.7 | $160.0 | $1.7 | 1% |
| OUS | $32.0 | $28.6 | $3.4 | 11.8% |
| EMEA | $12.9 | $12.3 | $0.7 | 5.5% |
| ROW | $19.0 | $16.3 | $2.7 | 16.6% |
| Total | $193.6 | $188.6 | $5.0 | 2.7% |
Company Earnings
| Amt | % of Sales | |
|---|---|---|
| Sales | $193.6 | |
| Cost of Sales | $72.0 | 37.2% |
| Selling, General, Admin | $133.0 | 68.7% |
| R & D | $19.8 | 10.2% |
| R & D | $19.8 | 10.2% |
| Other | $22.0 | 11.3% |

You’ve reached your limit.
We’re glad you’re finding value in our content — and we’d love for you to keep going.
Subscribe now for unlimited access to orthopedic business intelligence.

ME
Mike Evers is a Senior Market Analyst and writer with over 15 years of experience in the medical industry, spanning cardiac rhythm management, ER coding and billing, and orthopedics. He joined ORTHOWORLD in 2018, where he provides market analysis and editorial coverage.