Copy to clipboard
Medtronic reported fiscal 4Q25 orthopedic sales of $919 million, up 3.8% compared to the fiscal fourth quarter of 2024. For fiscal 2025, the company generated $3.46 billion in orthopedic sales, up 4.1% compared to the prior year.
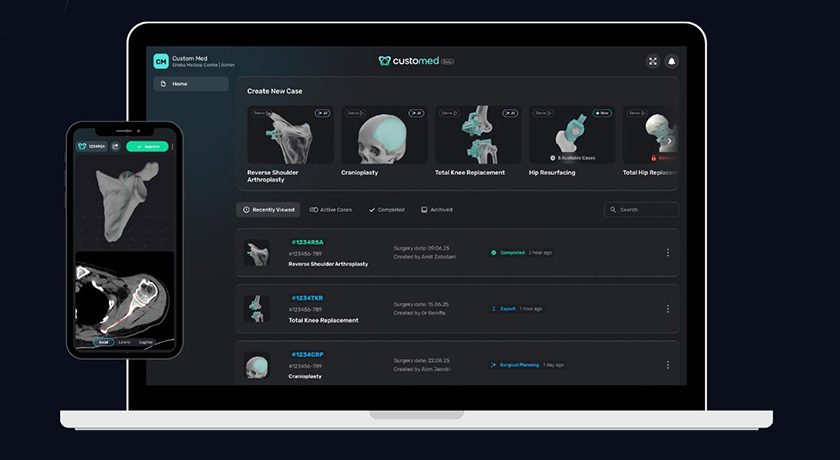
The company said the spine market has healthy demand, but its AiBLE technology ecosystem is driving competitive wins. Medtronic has an install base of more than 10,000 capital units, giving it a significant lead.
“By taking this portfolio of enabling technology and integrating the workflow, we’ve gone from a product story to a solution story,” said Medtronic CEO Geoff Martha. “As our customers are upgrading, they’re upgrading from a product to a broader ecosystem. So it’s not a linear upgrade. That is a durable advantage. We’re seeing the market growth is stable, and we’re seeing our competitive advantage growing.”
The company expects its competitive advance to increase as it prioritizes further investment into the AiBLE ecosystem.
Orthopedic Sales Data
Unless otherwise noted, all orthopedic sales data is provided in USD millions. We estimate orthopedic sales and growth rates on an as-reported basis.
Orthopedic Sales by Segment
| Segment | 4Q25 | 4Q24 | $ Chg | % Chg |
|---|---|---|---|---|
| Spine | $636.6 | $612.7 | $23.9 | 3.9% |
| Orthobiologics | $144.2 | $139.3 | $4.9 | 3.5% |
| Enabling Technology | $56.3 | $52.9 | $3.4 | 6.5% |
| Other | $81.9 | $80.3 | $1.6 | 2% |
| Total | $919.0 | $885.2 | $33.8 | 3.8% |
| Region | FY25 | FY24 | $ Chg | % Chg |
|---|---|---|---|---|
| Spine | $2,424.5 | $2,326.3 | $98.2 | 4.2% |
| Orthobiologics | $551.4 | $529.3 | $22.0 | 4.2% |
| Enabling Technology | $171.9 | $161.9 | $9.9 | 6.1% |
| Other | $316.7 | $309.3 | $7.4 | 2.4% |
| Total | $3,464.5 | $3,326.9 | $137.5 | 4.1% |
Orthopedic Sales by Geography
| Region | 4Q25 | 4Q24 | $ Chg | % Chg |
|---|---|---|---|---|
| US | $684.1 | $641.8 | $42.3 | 6.6% |
| OUS | $234.9 | $243.4 | ($8.5) | (3.5%) |
| Total | $919.0 | $885.2 | $33.8 | 3.8% |
| Region | FY25 | FY24 | $ Chg | % Chg |
|---|---|---|---|---|
| US | $2,593.4 | $2,446.5 | $146.9 | 6% |
| OUS | $871.0 | $880.4 | ($9.4) | (1.1%) |
| Total | $3,464.5 | $3,326.9 | $137.5 | 4.1% |
Company Earnings
| Amt | % of Sales | |
|---|---|---|
| Sales | $8,927.0 | |
| Cost of Sales | $3,147.0 | 35.3% |
| Selling and Admin | $2,721.0 | 30.5% |
| R & D | $684.0 | 7.7% |
| Other | $1,314.0 | 14.7% |
| Net Earnings | $1,061.0 | 11.9% |
Medtronic reported fiscal 4Q25 orthopedic sales of $919 million, up 3.8% compared to the fiscal fourth quarter of 2024. For fiscal 2025, the company generated $3.46 billion in orthopedic sales, up 4.1% compared to the prior year.
The company said the spine market has healthy demand, but its AiBLE technology ecosystem is driving competitive...
Medtronic reported fiscal 4Q25 orthopedic sales of $919 million, up 3.8% compared to the fiscal fourth quarter of 2024. For fiscal 2025, the company generated $3.46 billion in orthopedic sales, up 4.1% compared to the prior year.
The company said the spine market has healthy demand, but its AiBLE technology ecosystem is driving competitive wins. Medtronic has an install base of more than 10,000 capital units, giving it a significant lead.
“By taking this portfolio of enabling technology and integrating the workflow, we’ve gone from a product story to a solution story,” said Medtronic CEO Geoff Martha. “As our customers are upgrading, they’re upgrading from a product to a broader ecosystem. So it’s not a linear upgrade. That is a durable advantage. We’re seeing the market growth is stable, and we’re seeing our competitive advantage growing.”
The company expects its competitive advance to increase as it prioritizes further investment into the AiBLE ecosystem.
Orthopedic Sales Data
Unless otherwise noted, all orthopedic sales data is provided in USD millions. We estimate orthopedic sales and growth rates on an as-reported basis.
Orthopedic Sales by Segment
| Segment | 4Q25 | 4Q24 | $ Chg | % Chg |
|---|---|---|---|---|
| Spine | $636.6 | $612.7 | $23.9 | 3.9% |
| Orthobiologics | $144.2 | $139.3 | $4.9 | 3.5% |
| Enabling Technology | $56.3 | $52.9 | $3.4 | 6.5% |
| Other | $81.9 | $80.3 | $1.6 | 2% |
| Total | $919.0 | $885.2 | $33.8 | 3.8% |
| Region | FY25 | FY24 | $ Chg | % Chg |
|---|---|---|---|---|
| Spine | $2,424.5 | $2,326.3 | $98.2 | 4.2% |
| Orthobiologics | $551.4 | $529.3 | $22.0 | 4.2% |
| Enabling Technology | $171.9 | $161.9 | $9.9 | 6.1% |
| Other | $316.7 | $309.3 | $7.4 | 2.4% |
| Total | $3,464.5 | $3,326.9 | $137.5 | 4.1% |
Orthopedic Sales by Geography
| Region | 4Q25 | 4Q24 | $ Chg | % Chg |
|---|---|---|---|---|
| US | $684.1 | $641.8 | $42.3 | 6.6% |
| OUS | $234.9 | $243.4 | ($8.5) | (3.5%) |
| Total | $919.0 | $885.2 | $33.8 | 3.8% |
| Region | FY25 | FY24 | $ Chg | % Chg |
|---|---|---|---|---|
| US | $2,593.4 | $2,446.5 | $146.9 | 6% |
| OUS | $871.0 | $880.4 | ($9.4) | (1.1%) |
| Total | $3,464.5 | $3,326.9 | $137.5 | 4.1% |
Company Earnings
| Amt | % of Sales | |
|---|---|---|
| Sales | $8,927.0 | |
| Cost of Sales | $3,147.0 | 35.3% |
| Selling and Admin | $2,721.0 | 30.5% |
| R & D | $684.0 | 7.7% |
| Other | $1,314.0 | 14.7% |
| Net Earnings | $1,061.0 | 11.9% |

You’ve reached your limit.
We’re glad you’re finding value in our content — and we’d love for you to keep going.
Subscribe now for unlimited access to orthopedic business intelligence.

ME
Mike Evers is a Senior Market Analyst and writer with over 15 years of experience in the medical industry, spanning cardiac rhythm management, ER coding and billing, and orthopedics. He joined ORTHOWORLD in 2018, where he provides market analysis and editorial coverage.