Copy to clipboard
DePuy Synthes reported 3Q22 orthopedic sales of $2,094.7 million, +0.1% compared to 3Q21. However, when adjusted for foreign currency headwinds, the company grew +4.7% for the quarter.
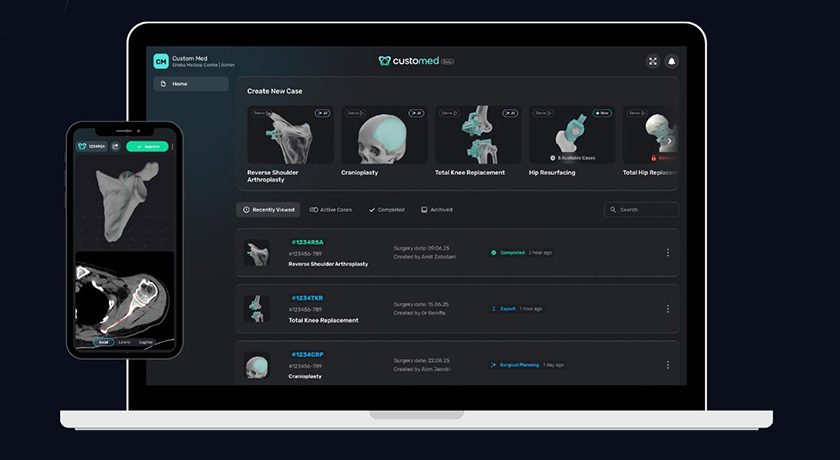
The company attributed the strong sales quarter to procedure recovery and its VELYS digital solutions.
“We are seeing procedures recovering. We posted a very strong September. Europe is recovering nicely. August slowed down given the holiday season, but September picked up. Asia is in fast recovery in India and Japan. China recovered nicely versus quarter two, but they’re still below pre-COVID levels. We expect that bolus to continue,” said Ashley McEvoy, Johnson & Johnson Executive Vice President, Worldwide Chairman, MedTech.
Johnson & Johnson’s leadership indicated that the company is very bullish about making further acquisitions given its strong cash position, but the market is not conducive to M&A right now.
Orthopedic Sales Data
All orthopedic sales data is provided in USD millions unless otherwise noted. Orthopedic sales and growth rates are estimated on an as-reported basis.
Orthopedic Sales by Segment
| 3Q22 | 3Q21 | $ Chg | % Chg | |
|---|---|---|---|---|
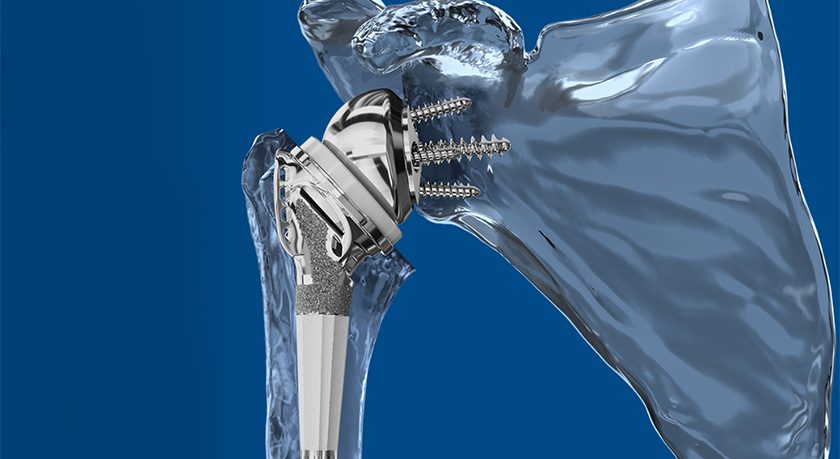
| Joint Replacement | $776.1 | $774.9 | $1.2 | 0.2% |
| Knees | $317.1 | $315.8 | $1.3 | 0.4% |
| Hips | $351.2 | $355.2 | ($4.1) | (1.1%) |
| Extremities | $107.8 | $103.8 | $4.0 | 3.9% |
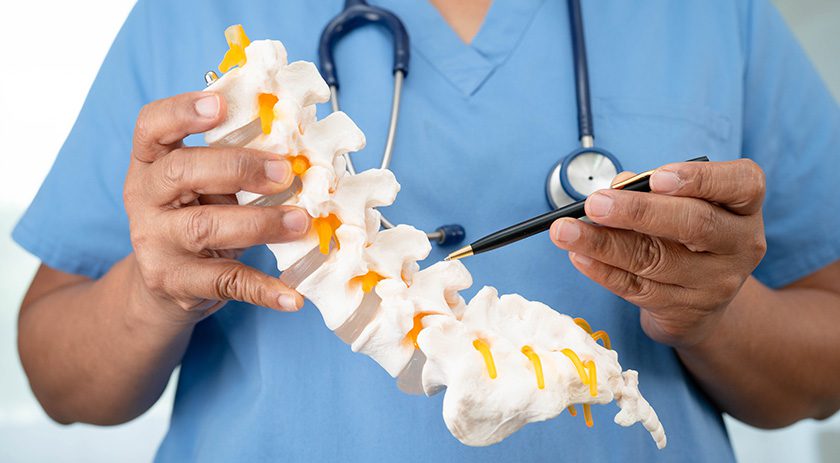
| Spine | $311.4 | $317.1 | ($5.7) | (1.8%) |
| Trauma | $688.4 | $685.9 | $2.5 | 0.4% |
| Sports Medicine | $149.7 | $145.5 | $4.2 | 2.9% |
| Orthobiologics | $88.7 | $89.0 | ($0.3) | (0.3%) |
| Other (CMF) | $80.5 | $79.4 | $1.0 | 1.3% |
| Total | $2,094.7 | $2,091.7 | $3.0 | 0.1% |
| 9m22 | 9m21 | $ Chg | % Chg | |
|---|---|---|---|---|
| Joint Replacement | $2,458.2 | $2,405.0 | $53.1 | 2.2% |
| Knees | $1,005.6 | $983.3 | $22.3 | 2.3% |
| Hips | $1,128.2 | $1,101.6 | $26.6 | 2.4% |
| Extremities | $324.4 | $320.2 | $4.2 | 1.3% |
| Spine | $942.3 | $985.8 | ($43.5) | (4.4%) |
| Trauma | $2,074.5 | $2,070.5 | $4.0 | 0.2% |
| Sports Medicine | $452.2 | $449.2 | $3.0 | 0.7% |
| Orthobiologics | $268.6 | $274.9 | ($6.3) | (2.3%) |
| Other (CMF) | $242.2 | $243.8 | ($1.6) | (0.7%) |
| Total | $6,438.0 | $6,429.3 | $8.6 | 0.1% |
Orthopedic Sales by Geography
| 3Q22 | 3Q21 | $ Chg | % Chg | |
|---|---|---|---|---|
| US | $1,309.6 | $1,248.5 | $61.2 | 4.9% |
| OUS | $785.0 | $843.2 | ($58.2) | (6.9%) |
| EMEA | $346.2 | $371.0 | ($24.8) | (6.7%) |
| Asia Pacific | $277.1 | $312.0 | ($34.9) | (11.2%) |
| Rest of World | $161.7 | $160.2 | $1.5 | 0.9% |
| Total | $2,094.7 | $2,091.7 | $3.0 | 0.1% |
| 9m21 | 9m20 | $ Chg | % Chg | |
|---|---|---|---|---|
| US | $3,934.4 | $3,817.8 | $116.7 | 3.1% |
| OUS | $2,503.5 | $2,611.6 | ($108.0) | (4.1%) |
| EMEA | $1,104.8 | $1,143.9 | ($39.1) | (3.4%) |
| Asia Pacific | $909.7 | $962.7 | ($53.1) | (5.5%) |
| Rest of World | $489.1 | $504.9 | ($15.8) | (3.1%) |
| Total | $6,438.0 | $6,429.3 | $8.6 | 0.1% |
Company Earnings
| Amt | % of Sales | |
|---|---|---|
| Sales | $23,791.0 | |
| Cost of Sales | $7,807.0 | 32.8% |
| Selling and Admin | $6,089.0 | 25.6% |
| R & D | $3,597.0 | 15.1% |
| Other | $1,840.0 | 7.7% |
| Net Earnings | $4,458.0 | 18.7% |
DePuy Synthes reported 3Q22 orthopedic sales of $2,094.7 million, +0.1% compared to 3Q21. However, when adjusted for foreign currency headwinds, the company grew +4.7% for the quarter.
The company attributed the strong sales quarter to procedure recovery and its VELYS digital solutions.
"We are seeing procedures recovering. We posted a...
DePuy Synthes reported 3Q22 orthopedic sales of $2,094.7 million, +0.1% compared to 3Q21. However, when adjusted for foreign currency headwinds, the company grew +4.7% for the quarter.
The company attributed the strong sales quarter to procedure recovery and its VELYS digital solutions.
“We are seeing procedures recovering. We posted a very strong September. Europe is recovering nicely. August slowed down given the holiday season, but September picked up. Asia is in fast recovery in India and Japan. China recovered nicely versus quarter two, but they’re still below pre-COVID levels. We expect that bolus to continue,” said Ashley McEvoy, Johnson & Johnson Executive Vice President, Worldwide Chairman, MedTech.
Johnson & Johnson’s leadership indicated that the company is very bullish about making further acquisitions given its strong cash position, but the market is not conducive to M&A right now.
Orthopedic Sales Data
All orthopedic sales data is provided in USD millions unless otherwise noted. Orthopedic sales and growth rates are estimated on an as-reported basis.
Orthopedic Sales by Segment
| 3Q22 | 3Q21 | $ Chg | % Chg | |
|---|---|---|---|---|
| Joint Replacement | $776.1 | $774.9 | $1.2 | 0.2% |
| Knees | $317.1 | $315.8 | $1.3 | 0.4% |
| Hips | $351.2 | $355.2 | ($4.1) | (1.1%) |
| Extremities | $107.8 | $103.8 | $4.0 | 3.9% |
| Spine | $311.4 | $317.1 | ($5.7) | (1.8%) |
| Trauma | $688.4 | $685.9 | $2.5 | 0.4% |
| Sports Medicine | $149.7 | $145.5 | $4.2 | 2.9% |
| Orthobiologics | $88.7 | $89.0 | ($0.3) | (0.3%) |
| Other (CMF) | $80.5 | $79.4 | $1.0 | 1.3% |
| Total | $2,094.7 | $2,091.7 | $3.0 | 0.1% |
| 9m22 | 9m21 | $ Chg | % Chg | |
|---|---|---|---|---|
| Joint Replacement | $2,458.2 | $2,405.0 | $53.1 | 2.2% |
| Knees | $1,005.6 | $983.3 | $22.3 | 2.3% |
| Hips | $1,128.2 | $1,101.6 | $26.6 | 2.4% |
| Extremities | $324.4 | $320.2 | $4.2 | 1.3% |
| Spine | $942.3 | $985.8 | ($43.5) | (4.4%) |
| Trauma | $2,074.5 | $2,070.5 | $4.0 | 0.2% |
| Sports Medicine | $452.2 | $449.2 | $3.0 | 0.7% |
| Orthobiologics | $268.6 | $274.9 | ($6.3) | (2.3%) |
| Other (CMF) | $242.2 | $243.8 | ($1.6) | (0.7%) |
| Total | $6,438.0 | $6,429.3 | $8.6 | 0.1% |
Orthopedic Sales by Geography
| 3Q22 | 3Q21 | $ Chg | % Chg | |
|---|---|---|---|---|
| US | $1,309.6 | $1,248.5 | $61.2 | 4.9% |
| OUS | $785.0 | $843.2 | ($58.2) | (6.9%) |
| EMEA | $346.2 | $371.0 | ($24.8) | (6.7%) |
| Asia Pacific | $277.1 | $312.0 | ($34.9) | (11.2%) |
| Rest of World | $161.7 | $160.2 | $1.5 | 0.9% |
| Total | $2,094.7 | $2,091.7 | $3.0 | 0.1% |
| 9m21 | 9m20 | $ Chg | % Chg | |
|---|---|---|---|---|
| US | $3,934.4 | $3,817.8 | $116.7 | 3.1% |
| OUS | $2,503.5 | $2,611.6 | ($108.0) | (4.1%) |
| EMEA | $1,104.8 | $1,143.9 | ($39.1) | (3.4%) |
| Asia Pacific | $909.7 | $962.7 | ($53.1) | (5.5%) |
| Rest of World | $489.1 | $504.9 | ($15.8) | (3.1%) |
| Total | $6,438.0 | $6,429.3 | $8.6 | 0.1% |
Company Earnings
| Amt | % of Sales | |
|---|---|---|
| Sales | $23,791.0 | |
| Cost of Sales | $7,807.0 | 32.8% |
| Selling and Admin | $6,089.0 | 25.6% |
| R & D | $3,597.0 | 15.1% |
| Other | $1,840.0 | 7.7% |
| Net Earnings | $4,458.0 | 18.7% |

You’ve reached your limit.
We’re glad you’re finding value in our content — and we’d love for you to keep going.
Subscribe now for unlimited access to orthopedic business intelligence.

ME
Mike Evers is a Senior Market Analyst and writer with over 15 years of experience in the medical industry, spanning cardiac rhythm management, ER coding and billing, and orthopedics. He joined ORTHOWORLD in 2018, where he provides market analysis and editorial coverage.