Copy to clipboard
Orthofix reported 3Q22 orthopedic sales of $114 million, +1.4% compared to the third quarter of 2021. Excluding currency headwinds, the company grew +4.8%.
The trauma, biologics and bone growth business lines turned in strong performances. Strategic distribution partners in the U.S., those who carry products from multiple Orthofix lines, have grown their revenue contribution by double-digits so far in 2022.
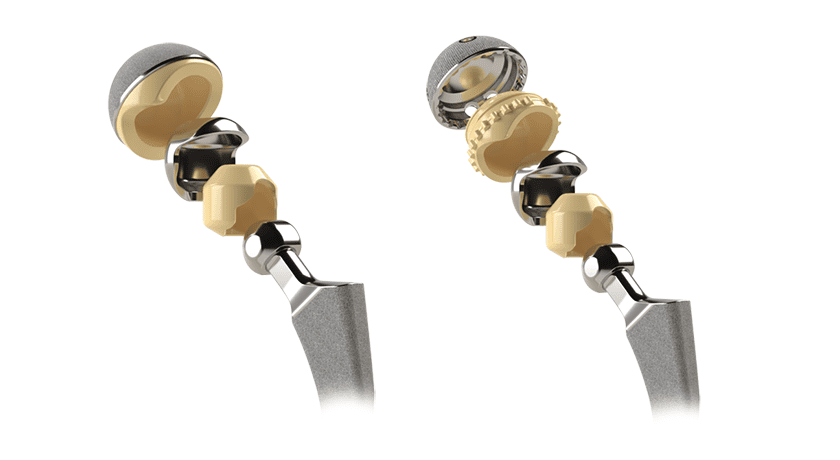
However, the spinal implant business suffered from an unfavorable product mix, a lack of large international stocking orders and global competition in motion preservation.
Orthofix CEO Jon Serbousek said, “There have been competitive headwinds out there, and we’re dealing with it with data and investments. We’re bringing experts from around the world to share not only their cervical experience, but also bringing researchers and experts from the large joint area who have lived through these activities and bringing their information and data forward. We’re in a good place to expand the cervical disc market. We’re leading in this effort so the cervical disc market has a growth opportunity in the future.”
The company’s merger with SeaSpine will create the sixth-largest spine player with a complementary portfolio and a differentiated surgical navigation system in 7D. Based on due diligence and third-party analysis of ZIP codes, Orthofix anticipates minimal overlap in distribution for the merged companies.
Orthofix expects 2022 total orthopedic sales in the range of $457 million to $463 million, representing growth of 1% to 2% at constant currency.
Orthopedic Sales Data
All orthopedic sales data is provided in USD millions unless otherwise noted. Orthopedic sales and growth rates are estimated on an as-reported basis.
Orthopedic Sales by Segment
| 3Q22 | 3Q21 | $ Chg | % Chg | |
|---|---|---|---|---|
| Spine | $25.9 | $28.2 | ($2.3) | (8.1%) |
| Trauma | $27.8 | $26.3 | $1.5 | 5.7% |
| Orthobiologics | $13.8 | $12.8 | $1.0 | 7.7% |
| Other (Bone Growth Therapies) | $46.5 | $45.2 | $1.4 | 3% |
| Total | $114.0 | $112.4 | $1.6 | 1.4% |
| 9mo22 | 9mo21 | $ Chg | % Chg | |
|---|---|---|---|---|
| Spine | $80.7 | $83.9 | ($3.3) | (3.9%) |
| Trauma | $78.9 | $76.3 | $2.6 | 3.4% |
| Orthobiologics | $42.7 | $41.4 | $1.3 | 3.2% |
| Other (Bone Growth Therapies) | $136.2 | $137.8 | ($1.6) | (1.1%) |
| Total | $338.5 | $339.4 | ($0.9) | (0.3%) |
Orthopedic Sales by Geography
| 3Q22 | 3Q21 | $ Chg | % Chg | |
|---|---|---|---|---|
| US | $88.0 | $86.0 | $2.0 | 2.3% |
| OUS | $26.0 | $26.4 | ($0.4) | (1.7%) |
| EMEA | $14.3 | $14.1 | $0.2 | 1.7% |
| APAC | $9.6 | $10.2 | ($0.6) | (5.7%) |
| ROW | $2.1 | $2.2 | ($0.1) | (4.1%) |
| Total | $114.0 | $112.4 | $1.6 | 1.4% |
| 9mo22 | 9mo21 | $ Chg | % Chg | |
|---|---|---|---|---|
| US | $263.2 | $264.6 | ($1.4) | (0.5%) |
| OUS | $75.3 | $74.8 | $0.4 | 0.6% |
| EMEA | $40.6 | $39.9 | $0.7 | 1.9% |
| APAC | $28.5 | $28.7 | ($0.2) | (0.6%) |
| ROW | $6.2 | $6.3 | ($0.1) | (2.2%) |
| Total | $338.5 | $339.4 | ($0.9) | (0.3%) |
Company Earnings
| Amt | % of Sales | |
|---|---|---|
| Sales | $114.0 | |
| Cost of Sales | $30.6 | 26.8% |
| General and Admin | $55.5 | 48.7% |
| Selling and Marketing | $19.3 | 16.9% |
| R & D | $11.9 | 10.5% |
| Other | $7.4 | 6.5% |
| Net Earnings | ($10.7) | (9.4%) |
Orthofix reported 3Q22 orthopedic sales of $114 million, +1.4% compared to the third quarter of 2021. Excluding currency headwinds, the company grew +4.8%.
The trauma, biologics and bone growth business lines turned in strong performances. Strategic distribution partners in the U.S., those who carry products from multiple Orthofix lines,...
Orthofix reported 3Q22 orthopedic sales of $114 million, +1.4% compared to the third quarter of 2021. Excluding currency headwinds, the company grew +4.8%.
The trauma, biologics and bone growth business lines turned in strong performances. Strategic distribution partners in the U.S., those who carry products from multiple Orthofix lines, have grown their revenue contribution by double-digits so far in 2022.
However, the spinal implant business suffered from an unfavorable product mix, a lack of large international stocking orders and global competition in motion preservation.
Orthofix CEO Jon Serbousek said, “There have been competitive headwinds out there, and we’re dealing with it with data and investments. We’re bringing experts from around the world to share not only their cervical experience, but also bringing researchers and experts from the large joint area who have lived through these activities and bringing their information and data forward. We’re in a good place to expand the cervical disc market. We’re leading in this effort so the cervical disc market has a growth opportunity in the future.”
The company’s merger with SeaSpine will create the sixth-largest spine player with a complementary portfolio and a differentiated surgical navigation system in 7D. Based on due diligence and third-party analysis of ZIP codes, Orthofix anticipates minimal overlap in distribution for the merged companies.
Orthofix expects 2022 total orthopedic sales in the range of $457 million to $463 million, representing growth of 1% to 2% at constant currency.
Orthopedic Sales Data
All orthopedic sales data is provided in USD millions unless otherwise noted. Orthopedic sales and growth rates are estimated on an as-reported basis.
Orthopedic Sales by Segment
| 3Q22 | 3Q21 | $ Chg | % Chg | |
|---|---|---|---|---|
| Spine | $25.9 | $28.2 | ($2.3) | (8.1%) |
| Trauma | $27.8 | $26.3 | $1.5 | 5.7% |
| Orthobiologics | $13.8 | $12.8 | $1.0 | 7.7% |
| Other (Bone Growth Therapies) | $46.5 | $45.2 | $1.4 | 3% |
| Total | $114.0 | $112.4 | $1.6 | 1.4% |
| 9mo22 | 9mo21 | $ Chg | % Chg | |
|---|---|---|---|---|
| Spine | $80.7 | $83.9 | ($3.3) | (3.9%) |
| Trauma | $78.9 | $76.3 | $2.6 | 3.4% |
| Orthobiologics | $42.7 | $41.4 | $1.3 | 3.2% |
| Other (Bone Growth Therapies) | $136.2 | $137.8 | ($1.6) | (1.1%) |
| Total | $338.5 | $339.4 | ($0.9) | (0.3%) |
Orthopedic Sales by Geography
| 3Q22 | 3Q21 | $ Chg | % Chg | |
|---|---|---|---|---|
| US | $88.0 | $86.0 | $2.0 | 2.3% |
| OUS | $26.0 | $26.4 | ($0.4) | (1.7%) |
| EMEA | $14.3 | $14.1 | $0.2 | 1.7% |
| APAC | $9.6 | $10.2 | ($0.6) | (5.7%) |
| ROW | $2.1 | $2.2 | ($0.1) | (4.1%) |
| Total | $114.0 | $112.4 | $1.6 | 1.4% |
| 9mo22 | 9mo21 | $ Chg | % Chg | |
|---|---|---|---|---|
| US | $263.2 | $264.6 | ($1.4) | (0.5%) |
| OUS | $75.3 | $74.8 | $0.4 | 0.6% |
| EMEA | $40.6 | $39.9 | $0.7 | 1.9% |
| APAC | $28.5 | $28.7 | ($0.2) | (0.6%) |
| ROW | $6.2 | $6.3 | ($0.1) | (2.2%) |
| Total | $338.5 | $339.4 | ($0.9) | (0.3%) |
Company Earnings
| Amt | % of Sales | |
|---|---|---|
| Sales | $114.0 | |
| Cost of Sales | $30.6 | 26.8% |
| General and Admin | $55.5 | 48.7% |
| Selling and Marketing | $19.3 | 16.9% |
| R & D | $11.9 | 10.5% |
| Other | $7.4 | 6.5% |
| Net Earnings | ($10.7) | (9.4%) |

You’ve reached your limit.
We’re glad you’re finding value in our content — and we’d love for you to keep going.
Subscribe now for unlimited access to orthopedic business intelligence.

ME
Mike Evers is a Senior Market Analyst and writer with over 15 years of experience in the medical industry, spanning cardiac rhythm management, ER coding and billing, and orthopedics. He joined ORTHOWORLD in 2018, where he provides market analysis and editorial coverage.